Breathing Data: How Air Quality Monitoring Platforms Are Protecting Our Health
Every breath you take tells a story. Whether you're in a busy city, near an industrial zone, or in the middle of a UAE dust storm the air around you contains invisible particles and gases that directly affect your health. The question is: are we paying attention? Thanks to modern Air Quality Monitoring platforms, we finally have the tools to listen.
This blog explores how air quality monitoring platforms work, why they matter, what we're measuring, and how innovation :s including a school-focused tool called SASI :is taking public health protection to the next level.
What Is an Air Quality Monitoring Platform?
An air quality monitoring platform is a complete integrated system from sensors in the field to a dashboard on your phone, all in real time:
Sensors: PM2.5, PM10, CO, NO₂, O₃, and SO₂ probes measure pollutant concentrations continuously.
Datalogger: Embedded hardware stores and timestamps every reading locally before transmitting it onward.
IoT Network: WiFi, cellular, or LoRa connections send data to the cloud with minimal delay.
Cloud & AI: Databases store readings while ML models detect anomalies and forecast future pollution.
Dashboard: Web and mobile interfaces display live AQI maps, trend charts, and health alerts to the public.
What Are We Actually Measuring?
Six key pollutants form the backbone of air quality science:
● PM2.5: Tiny particles from vehicle exhaust and combustion that penetrate deep into your lungs — linked to cardiovascular disease.
● PM10: Larger dust particles from storms and construction that irritate the respiratory system.
● CO: From incomplete combustion — impairs your blood's ability to carry oxygen; dangerous at high concentrations.
● NO₂: Produced by transport and industry — worsens asthma and contributes to smog.
● O₃ (Ozone): A photochemical pollutant that causes coughing and chest tightness, especially in UAE summers.
● SO₂: From industrial facilities — aggravates respiratory conditions and contributes to acid rain.
Understanding the Air Quality Index (AQI)
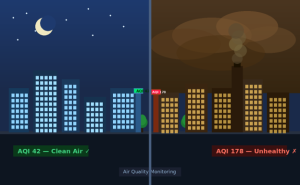
The AQI converts complex measurements into a single number so the public can act on it. The scale runs 0–500:
0–50 🟠 Good :Air is clean. No restrictions.
51–100 🟡 Moderate :Acceptable; some pollutants may affect very sensitive people.
101–150 🟠 Sensitive Groups :Children and elderly should reduce outdoor time.
151–200 🔴 Unhealthy :Everyone may feel effects. Limit outdoor exertion.
201–300 🟣 Very Unhealthy :Serious health effects for all. Avoid outdoor activities.
301–500 ⚫ Hazardous : Emergency conditions. Stay indoors.
The Leading Platforms: Who's Watching the Air?
🇦🇪 UAE NAQP: The official UAE government platform — real-time AQI maps across all 7 Emirates, integrated with national weather systems and automated alerts.
🌍 IQAir: A globally trusted Swiss platform with station-level granularity, multi-day forecasting, and full historical archives. Used by millions worldwide.
🗺 WAQI: Aggregates real-time data from government stations in 100+ countries on an interactive global map — one of the most comprehensive free public resources.
🤖 BreezoMeter: The most AI-advanced platform — uses ML for street-level hyperlocal forecasting and personalised health recommendations via location-aware alerts.
The Real Challenges of Monitoring Air Quality
● Sensor Drift: Calibration errors accumulate over time, quietly reducing data accuracy.
● Dust Storms: UAE's frequent sandstorms coat sensor optics — exactly when accurate data is needed most.
● Extreme Heat: High temperatures degrade sensor components and shorten operational lifespan.
● Coverage Gaps: High costs mean rural areas often go unmonitored, leaving blind spots in the data.
● Network Reliability: Communication failures interrupt continuous data streams during critical events.
Our Innovation: The School Air Safety Index (SASI)
As part of our project at Fujairah University, we proposed SASI — converting raw AQI data into one practical answer for every teacher and parent:
"Is it safe for students to be outside today?"
✅ 0–50 Safe — Outdoor activities permitted.
⚠ 51–100 Caution — Sensitive students reduce outdoor time.
🔶 101–150 Limited — Reduce PE and outdoor assemblies.
🚫 151–200 Indoors Only — Move all activities indoors.
🔴 201–300 High Risk — Cancel all outdoor activities.
🚨 301+ Emergency — Activate health emergency protocol.
What's Next: The Future of Air Quality Monitoring
● AI Pollution Prediction: ML on historical data will forecast AQI hours ahead — enabling public warnings before pollution peaks.
● Drone Air Monitoring: Sensor-equipped drones will collect data from hard-to-reach areas and altitudes during dust storms.
● Green Route Navigation: Apps will recommend travel paths with the lowest pollution exposure.
● Blockchain Data Integrity: Pollution data stored on blockchain ensures it's tamper-proof and trusted by agencies.
● Smart Classroom Sensors: In-classroom CO₂ and temperature monitoring will maintain healthy learning environments.
● Satellite-Integrated Mapping: Regional pollution mapping for transboundary assessments across the GCC.
Clean air isn't a luxury — it's a right. The technology to monitor, understand, and act on air quality already exists. The challenge now is making sure that data reaches every school, every family, and every decision-maker who needs it. That's the mission.